
Tucked in the foothills of the San Gabriel Mountains in Pasadena, California, NASA’s Jet Propulsion Laboratory (JPL) looks and feels like a high-security college campus for engineering nerds. From the streetlight banners celebrating the latest satellite launch to the bungee rocket toys in the gift shop, the facility—which is formally a part of the California Institute of Technology—leaves no doubt about its mission: “It is really an aerospace company,” is how Jay Famiglietti, NASA’s senior water scientist who runs a project called the Western States Water Mission, puts it. The vast majority of JPL’s thousands of employees are engineers and technicians who build robots and rockets to ship into space. Scientists like Famiglietti are there to make sure that all that hardware serves some sort of greater purpose benefitting humanity. Right now, for his research team, that purpose is mapping the dwindling water supply of the drought-gripped western United States.
Famiglietti is a hydrologist—a specialist in the world’s water systems. Before he arrived at JPL, he was accustomed to looking at rivers, oceans, and aquifers from ground level. Now, as a NASA researcher, he looks at them from space. His project seeks to create a computer model that will track and predict the movement of every concentration of water in the western part of the country: how much snow is in the mountains, how much moisture is in the soil, how much groundwater the aquifers contain, how much water is in the rivers and how quickly it’s flowing, where floods will occur, and what's the water volume of the reservoirs. Once his team shows it can be done regionally, they will expand the project to a global scale.

The ongoing drought presents an obvious case for such an undertaking, as do the outdated methods we use to measure water concentration. Nearly two-thirds of California’s water supply comes from snowmelt out of the Sierra Nevada Mountains, but estimates of the volume of snowpack are rough at best. As they have been doing for over a century, state surveyors make their estimates by planting measuring poles in a handful of locations in the mountains. They complement that method with a technology they have been using since the 1980s: scattering the landscape with scales that weigh the snow that falls on them.
To measure the volume of the aquifers, which are being depleted in California at a catastrophic rate, researchers can’t do much better than making educated guesses based on how far wells have to be drilled in order to hit water tables. Even reservoirs defy accurate measurement, due to our limited understanding of the ways that sediment settles and how that changes the shape of lake floors. “Hydrology is nothing but a data gap,” Cédric David, a young, scruffy French hydrologist on Famiglietti’s team, who specializes in river systems, told me. “Pretty much, we don’t know anything.”
NASA took a big step toward filling that data gap in 2002 with the launch of the Gravity Recovery and Climate Experiment—GRACE—by engineers at JPL and the University of Texas. GRACE is composed of two satellites, each about the size of a Volkswagen Bug. The pair orbits around the world, with a distance of 250 kilometers between them. As one approaches a mountain range, or any part of the world where the crust of the earth is thicker or denser than elsewhere, the force of gravity acting upon that satellite increases as a function of the greater planetary mass beneath it. The result is a slight acceleration. Where there is a basin, the pull is slightly less; the satellite drags.
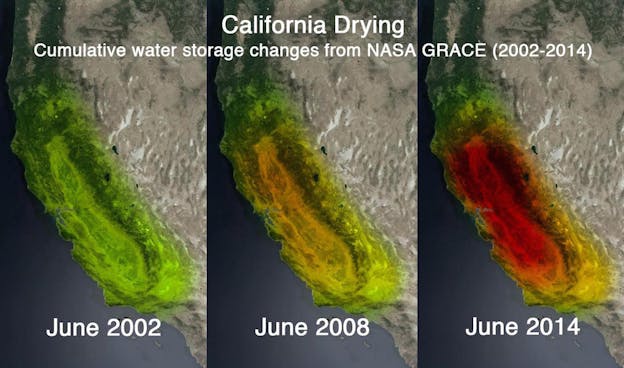
As the satellites alter their speeds relative to each other and in response to these variations in gravitational pull, GRACE measures the miniscule fluctuations in the undulating distance between them. By doing so, the GRACE satellites can map the topography of the earth’s gravitational field. Every ten days, GRACE generates a new global snapshot of that map; the differences from one snapshot to the next indicate short-term changes in the shape of the earth’s mass—depletion in red, accumulation in blue—typically associated with the displacement of water. In some cases, those changes are otherwise invisible: For instance, the draining of aquifers hundreds or thousands of feet underground.
When you look at the snapshots, the melting ice sheets of Greenland and Antarctica pop off the map. The next most prominent indicators of water displacement are the retreating glaciers: Alaska and Patagonia. “They’re just melting like crazy,” says J.T. Reager, one of Famiglietti’s colleagues. (The Himalayan glaciers are melting, too, but since they’re inland the water doesn’t displace as visibly, so the signal is more muted.) Then comes the drainage of some of the world’s major underground basins: India-Pakistan, the Middle East, and California. In the northern latitudes and the tropics, there are also broad belts of blue signals, possibly due to the increase in moisture moving from the cool oceans to the warming continents. The net result is a dichotomous planet, in which the dry regions are becoming drier, and the wet regions wetter.
Last September, an image from the GRACE project went viral when Science featured it on its cover. The snapshot shows a topographical picture of the state of California, with the vast Central Valley soaked in red, then shading into orange, yellow, and green at the edges of the state, like a tie-dyed t-shirt. The red indicates trillions of gallons of groundwater loss, the consequence of massive overdrawing of aquifers in the absence of surface water. Based on GRACE’s data, Famiglietti estimates that at current rates of withdrawal, these aquifers, some of which took millions of years to fill, will be gone within decades.
GRACE will soon be one of many NASA satellite missions launched by JPL that enable hydrologists to better predict and describe both droughts and floods worldwide. In January of this year, NASA launched the Soil Moisture Active Passive Mission—SMAP—a satellite that measures water content in the top two inches of the earth’s soil. In 2017, a new pair of GRACE satellites will be launched into orbit. In 2020, the Surface Water and Ocean Topography satellite is scheduled to launch, which will map the world’s freshwater supplies and track small-scale circulation patterns in the oceans. “We’re entering the golden age of satellite missions for water,” says Famiglietti.
NASA is also surveying the alpine snowpack from a closer vantage point, at 21,500 feet in the air. Tom Painter is the Principal Investigator for JPL’s Airborne Snow Observatory (ASO), part of Famiglietti’s Western States Water Mission, which is employing a new method of remote sensing to measure snow in the mountains.
To get a complete picture of the Tuolumne River Basin, whose snowmelt flows into Hetch Hetchy Reservoir, where San Francisco’s potable water supply is stored, Painter’s plane takes about 26 passes over the 1,200 square kilometer region—about three and a half hours of flying time. The plane is equipped with two types of measuring instrument: an Imaging Spectrometer system, which gauges the reflectiveness of the ground surface, and something called a “Scanning LiDAR.” The LiDAR instrument shoots a laser at the earth below at a rate of 100,000 to 400,000 pulses per second, tracking the time it takes for each pulse to complete its trip from the plane to the surface and back again. The trillions of data points it collects are then combined to create a topographical image of the landscape, allowing Painter to measure how much snow has fallen over an area 39 million times larger than what can be covered by traditional methods.
With every passing month of California’s drought, the dwindling Sierra snowpack forces water managers to make ever more painful decisions on how to allocate a shrinking water supply. By making it possible to estimate the overall amount of snow in the Sierra Nevada range, the ASO allows for more accurate estimates of snowmelt. Absent the ASO data, the model has shown a consistent 37 percent error for the Tuolumne basin, Painter told me. “If you assimilate that information from ASO,” he says, “then it realizes, ‘Good God, I don’t have all that snowpack I thought I did.’”
The new data is so precise that when administrators for San Francisco’s water supply system first calculated their accuracy, they spent a week looking for errors: The degree of precision just didn’t seem credible. “As one water manager put it to me at the Western Snow Conference,” Painter recalls, “He said, ‘Tommy, you’ve got yourself a billion dollar scatterplot there.’”
Painter’s surveys over the Sierra Nevada are a trial run for the planet. Eventually, he expects LiDAR technology to map the topography of the entire world’s snowpack—including in countries like Iran and Iraq, which are not practical to monitor by plane—both by satellite and by airplane. Between ASO and the growing number of satellite missions tracking global water displacement, David, the French researcher, believes that within the decade, NASA will find a way to begin to fill every hydrological data gap in the world. “You’re putting everything together and then suddenly you have a broad vision of how much water we have,” he says.
What that means in practice is putting together a picture of the vast extent to which global water flows are being disrupted by human activity and how desperate circumstances have become all over the world. Like the model they’re constructing, the problems Famiglietti and his colleagues are surveying are stupefying in their proportions. But it’s a scale they seem to have grown accustomed to.
“The reason we came to this work,” says Reager, “is because we wanted to do something big.”